|
Part 4 - Creating a TAS Professional report |

  
|
|
Part 4 - Creating a TAS Professional report |
|
In this section you will create a report showing sales and customer information. You'll be able to specify the sort field at run time and a range of customers to include on the report.
To create reports with TAS Professional you will probably always start with the Edit Report Format program. Then, after you have the format completed, return to the Source Editor, and create the code necessary to setup the data for your report. This is similar to the Screen Editor/Source Editor combination, except that you cannot change Report Format properties at runtime.
To get started click on the Reports button. A completely new window will be opened and something similar to the screen below will be displayed:

As with the Screen Editor, the higher your resolution the more you'll see on the screen.
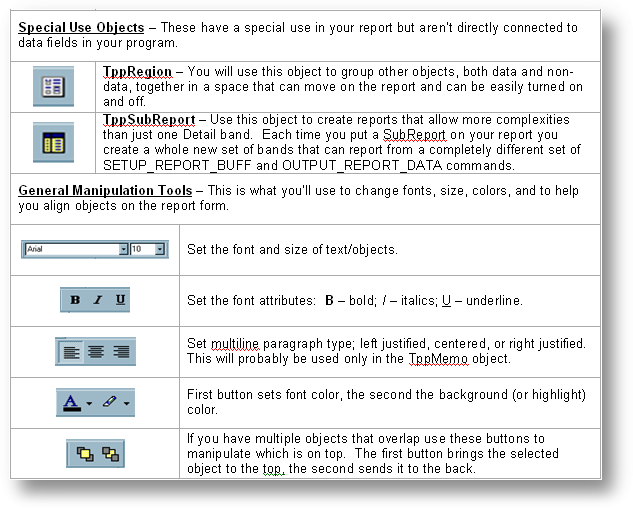
There is just a single palette in the Report Editor. There's actually only 11 objects that can be placed on the format. There are, however, several options that will make your reports look better, and, menu options that will add or subtract bands from the format.
Every report is made up of bands. These will control what will print, where it occurs on the report, etc. When the report format is first displayed there are three bands, these are Header, Detail and Footer. Many reports will use just these three.
Report Editor Menu Options
You can easily control the bands that make up your report from the menu. Right now click on the Report menu item at the top of the screen. The following submenu should appear:
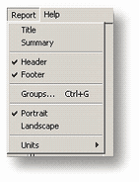
Notice that the Header and Footer items are checked. If you uncheck either of these (by clicking on the menu item) the band will disappear on the form. Click on it again and it will be back. There's no Detail option since if you don't have a Detail band you don't have a report! The Header band will print each time you start a new page and the Footer band will print at the bottom of each page.
Two other bands that are also part of that menu option are Title and Summary. The Title band prints once at the very beginning of the report. The summary band also prints once, at the very end of the report.
Groups are a very important option. They allow you to literally group records together. This allows you to force a page break when a group changes, keep group records together, and create GroupHeader and GroupFooter bands that print with the Group. If you're going to print checks, invoices, statements, or other similar reports you will end up using the Grouping feature. If you don't you will have items from one check on another!
Portrait and Landscape are mutually exclusive, you choose one or the other. Portrait prints the report in what might be called "standard format", tall and narrow. Landscape turns the paper 90 degrees so that the paper will print "sideways" or short and wide. If you need to print a very wide report try Landscape, otherwise you'll probably always use Portrait, which is the default.
Units allows you to chose the measurement system for the report. This defaults to Inches. If you click on the Units menu item the options available will be displayed. You can change to another value at any time and all properties where a position value is needed will be recalculated.
If you click on the View menu item there are two options listed there. The first, Rulers, should be checked. If you click on this option it will remove the rulers from the report form. You'll probably always want the rulers to be displayed.
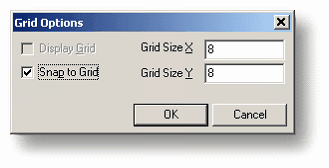
The other option in View is Grid Options. If you click on this menu item the following dialog box will be displayed:
This will allow you to choose the granularity of the grid that overlays the report form. This is the same as the grid in the Screen Editor, except it doesn't display the dots in the Report Editor. In most cases you will leave these values unchanged. Click on OK or Cancel to close the window.
The Edit menu is fairly standard and should be familiar to you from other Windows® programs.
The File menu is also standard except for a few options specific to the Report Editor. These are the list of the most recent report formats at the end of the menu. If you wish to reload any of the report formats listed just click on the file name.
Another option in the File menu is Page Setup. Click on the option and the following screen should appear:
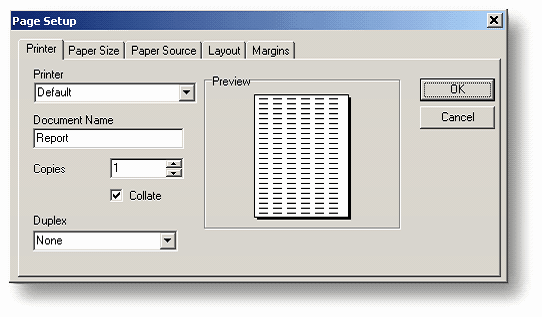
You can make this report for a specific printer by choosing the printer here. However, in most cases the printer should be Default and allow the user to choose at runtime. The Document Name should always be Report. Duplex specifies printing on both sides of the paper. Make sure your printer allows this before you choose this option.
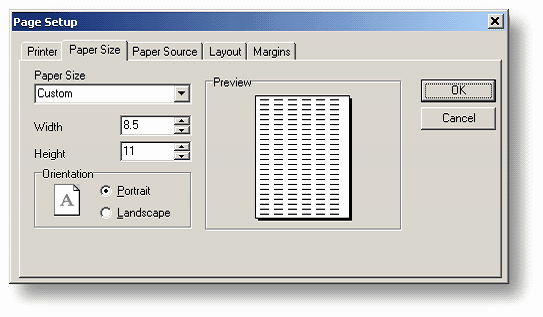
The Paper Size tab allows you to choose a size other than the standard 8.5 x 11 inches. As explained above, you can also choose Portrait or Landscape and get a graphic representation of what it looks like.
The Paper Source tab allows you to choose where the paper will be fed. These are general options and can be safely ignored.
Layout allows you to split the page into columns:
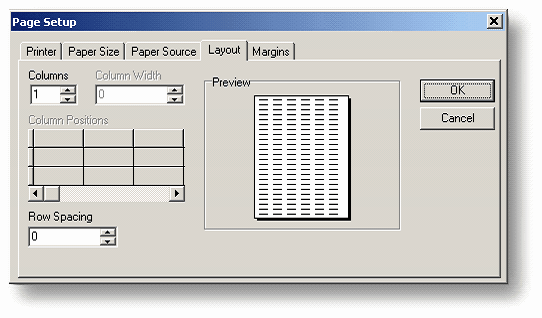
All new report formats start as a single column. If you, however, are going to print labels you will want to change the Columns value to match the number of columns of labels on the page. You will probably also want to remove the Header and Footer bands since they won't change size. Change the Columns value to 4 and notice what happens to the report format (make sure you're starting with a new form!). You should see the Detail band getting narrower, however the Header and Footer bands stay the same size. You will also see ColumnHeader and ColumnFooter bands. These have the same effect as the standard Header and Footer except they will print at the beginning and end of each column. Don't forget to reset the number of columns to 1 before you leave this page!
The last tab is Margins:
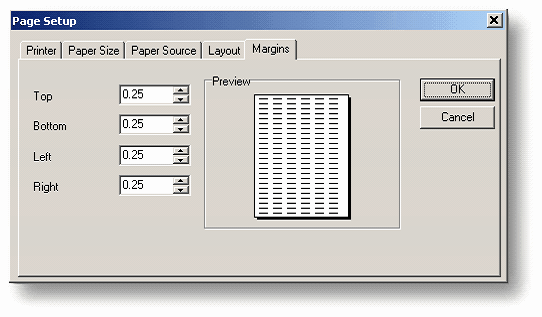
In a default report all four margin values will be set to ¼ inch. You can adjust those as needed. However, before you make them smaller make sure your printer will be able to print closer to the edge of the paper.
Once you've made your adjustments click on the OK button to save or Cancel to undo your entries.
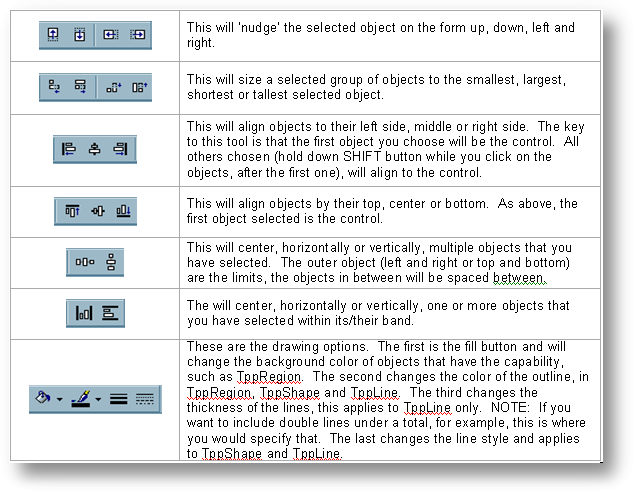
Next we'll cover the icons in the tool bars above the report format.
NOTE: Your tool bar may look differently when it's first displayed. You can always move the groups around by grabbing the group at the far left side and moving it where you want it.
A Simple Report
For your first report you're going to do something fairly simple, just list the records in your CUSTOMER file. If the Report Editor is not loaded do so now by clicking on the Reports button on the main TAS Professional tool bar. The default Report Editor screen should be displayed. The process for putting objects on the form is very similar to what you did in the Screen Editor with a couple of exceptions; first, you will find the number of properties for each object is less than what you had in the Screen Editor, also, the report format area is broken up into three blocks or bands, as explained above.
NOTE: If you have further questions about the different objects or bands in the Report Editor please refer to the TAS Professional Help file. You can access this in the Report Editor by clicking the Help menu option and then the TAS Pro Help item. This is the same Help file that you can access in the Screen/Source Editor.
Click somewhere in the report form above the bar that says "^ Header." The "^" denotes that the Header band is above this bar. Same with the Detail band that comes next and the Footer band that is at the end.
When you click in the Header band notice that the OI now displays information about the Header. Click in the Detail and Footer and you'll see the properties change. Now move the mouse cursor so that it's directly over the bar that says "^ Header." The mouse cursor should change from the standard arrow to a double- headed arrow that is vertical instead of canted off to the left. While the mouse is positioned over the bar press down on the left mouse button. While holding the mouse button down scroll the mouse up and down. You should see a representation of that bar (just the outline) move with the mouse. When you release the left mouse button the size of the Header band should change, depending on where you moved the mouse. This is how you resize the band.
NOTE: Sometimes you will make a change to the report that will create new bands on the page that have no space that is automatically setup for them. A good example of this is a Group band. When it's created the GroupHeader and the GroupFooter band bar will be tight against the Header and Footer band bar. This means that you will have to resize the band larger if you want to put something in those bands. Always look for the "^" and a name in the bar that specifies what type of band is above the bar. Even when the bars are tight together you can still click on the bar of the band you want to increase and scroll down the screen.
NOTE: When you resize a band all the bands below move up or down automatically. As you create large reports you may move part of the report format off the page. A standard scroll bar will appear on the right side of the editing area that will allow you to move the format up and down. The same applies if the format is too wide to fit the area available.
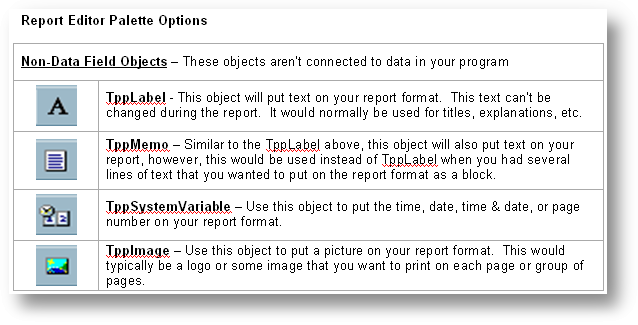
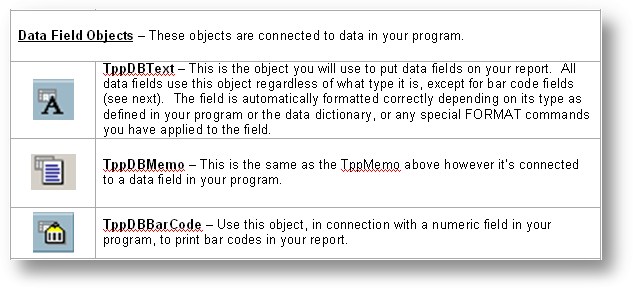
The first step is to put a title in the Header band. Click on the TppLabel object (the one that looks like an A by itself) and click anywhere in the Header band. It should put a small object that says "Label1" or something similar. If you look at the OI you should see TppLabel in the display box near the top and the properties appropriate to this object should be displayed.
In the Caption property enter: A Simple Report. When you press the ENTER key or otherwise move off the property that caption will take the place of the Label1 name. This works just like the TLabel object did in the Screen Editor. Now, click on the object and drag it to the top of the band so that it's tight against the ruler. Once you have it there try dragging it down one step. You'll see the snap-to-grid process working just like you did in the Screen Editor.
Make the font a little bigger by clicking on the font size drop down box in the palette. Change the font size to 14.
Click on the "Center Horizontally" button in the palette above the format. This is the button that looks like three books between bookends. The hint that appears when you hold the mouse over the button is: "Center Horizontally in Band." Your caption should now be centered in the band.
Drop a TppSystemVariable object below the label you added above. Notice that it uses the same font size that was changed above. That's ok for right now but you'll want to make sure to change the size back to 10 before you put the actual data fields on the form. In the VarType property click on the down arrow and choose the vtDateTime property. To finish with this object click on the Center button to center this object in the band.
To the right of the report title drop another TppSystemVariable. You might want to change the font size back to 10. Set the VarType property to vtPageNoDesc. Set Left to 7.25 and Top to 0.0833 (top should be the same as the report title).
NOTE: If you change the size or location of any object, including bands, by adjusting the object directly, the new sizes/locations will not be updated in the OI until you switch to a different object and then switch back. The status bar at the bottom of the report format will give you up-to-date information.
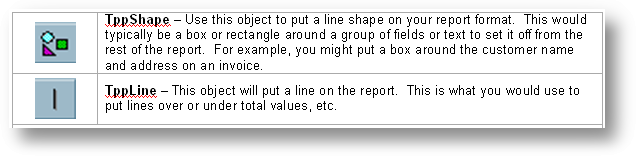
Put the following TppLabel objects on the report form in the Header band (they should be placed so that they rest right on the bottom of the band or just above the band name bar):
| TppLabel: | Caption=Cust Code Left=2.2187 |
| TppLabel: | Caption=Customer Information Left=3.0833 |
| TppLabel: | Caption=Phone Number Left=5.6667 |
Now you're going to put fields on the report. Click on the TppDBText icon on the palette and drop it in the Detail band (directly below the Header band). The Top property value should be 0. This means that it's at the top of the current band (or directly below the Header band name bar). Set the Left property to 2.3333. Double click in the DataField property. The same dictionary field lookup grid that you are familiar with from the screen and source editors is displayed
NOTE: You don't have the option to display defined fields from a source file since the report editor is disconnected from the screen/source editors. However, you can switch back and forth by clicking on the TAS Professional button in your task bar to return to the screen/source editor or the TAS Report Writer button to return to the Report Editor.
If the CUSTOMER file is not displayed as the initial choice then click on the drop down button and choose the CUSTOMER data file. Then double click on the CUSTCODE field. The value CUSTCODE{3} will be placed in the DataField property. The {3} specifies that the field is 3 characters in size when displayed.
NOTE: You can also enter your own field names. Case doesn't matter (upper or lower). As long as the names you enter here match the values in the record or elsewhere in your program. Whatever you put here will be used when running the report. You can even use arrays, so a legal DataField property value might be test[1] or fld_lname[cntr], etc.
The reason the program keeps the display size is to help you estimate the width you need when the report runs. To set the default object width double click on the Width property value. The object will change in size to approximately 0.2844. This might be a little narrow since the field will be all upper case characters so increase the Width to 0.3229.
Now add the following fields to the report. The Top property value is provided since the other fields will be placed under one another. Make sure the Detail band has enough vertical room for the objects. If you need some more space just click and hold on the Detail band name bar and pull it down a little. It should be at least 1" in height or more. You will shorten it up when you're done.
| TppDBText: | DataField=CUSTNAME Left=3.0833 Top=0 Width=2.375 |
| TppDBText: | DataField=CUSTCOMP Left=3.0833 Top=0.1979 Width=2.375 |
| TppDBText: | DataField=CUSTADDR Left=3.0833 Top=0.3958 Width=2.375 |
| TppDBText: | DataField=CUSTCITY Left=3.0833 Top=0.6042 Width=2.375 |
| TppDBText: | DataField=CUSTSTATE Left=3.0833 Top=0.8021 Width=0.2083 |
| TppDBText: | DataField=CUSTZIP Left=3.4167 Top=0.8021 Width=0.9479 |
| TppDBText: | DataField=CUSTAREA Left=5.6667 Top=0 Width=0.2844 |
| TppDBText: | DataField=CUSTPHONE Left=6 Top=0 Width=0.7583 |
Move the Detail band name bar up so that it's directly under the last text field you put on the form (State & Zip). If you click on the band directly the Height value should be about 0.9687. Notice that the PrintHeight property has been set to phStatic (the default value). If you add to the Height value there will be a space between the blocks of data when it prints. If there's no space then there will be no space between the records when they print.
There is no need for a Footer so turn it off by clicking on the Report->Footer menu item. The check mark next to the name will be removed and the Footer band will also.
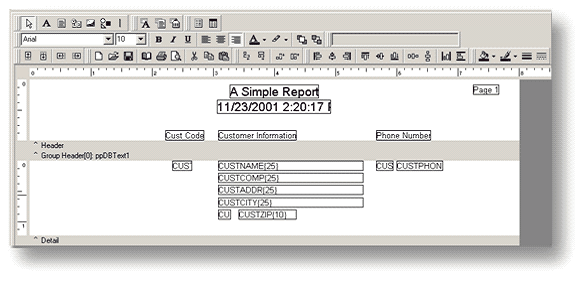
When you get here the report format should look like the following:
Click on File->Save. The standard save dialog will be displayed. Enter SimpleReport for the file name and click on the SAVE button.
Next you need to add the code to your program to link in the report format. Click on the TAS Professional button in your task bar to bring the screen/source editor active. If screen (SOEntry.DFM) is not loaded do so now.
Add a TButton to the screen at Left=376, Top=200, Width=75, Caption=Print, Name=btnPrint. The button should be placed between the navigator and the exit button. Save the screen form.
Load the source file (SOEntry.SRC) if it isn't already loaded. Add the following line immediately after the second #WinForm line:
#WinReport SimpleReport
This has basically the same effect as the WinForm compiler directive. It will load the report form during compilation and will make sure that all of the fields used in the report will be part of this program, even if they aren't used anywhere else.
At the bottom of the current code (after the lookup .SELECT routine) put the following:
btnPrint.click:
setup_report_buff rb_num 1 reportname 'simplereport'
scan @cust_hndl key custcode
output_report_data rb_num 1
ends
print_report
ret
The first line is the standard event label that you should be familiar with by now. The second line tells your program to load the report form and setup the first buffer. A modification of this report later will show how to setup multiple buffers.
NOTE: You must always setup buffer 1 first and specify the report name as part of that command.
The third and fifth lines (SCAN and ENDS) scroll through the customer file in customer code order. The line in the middle (output_report_data), creates the buffer records that will be used to print the actual report. The fields you have placed on the report form will be accessed to create the buffer records. The PRINT_REPORT command will do the actual printing. The last line, of course, is the standard RET from all event routines.
You can easily change the records that appear in the report by modifying the SCAN command. Restrict the records printed or change the order the records appear by changing the KEY value.
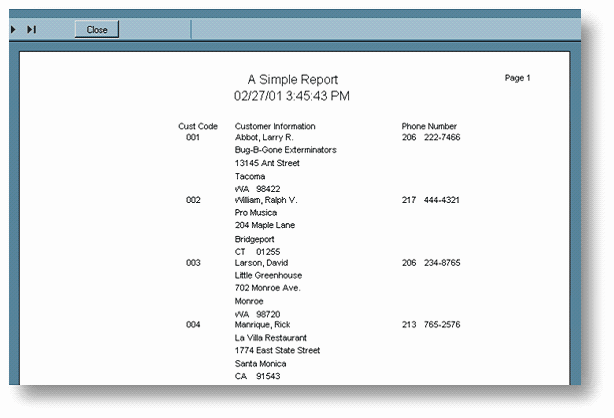
Compile the program by clicking on the Compile button or by pressing the F9 key. After the program compiles (assuming it compiled properly), press the ENTER key twice (once to acknowledge the end of the compiling process and once to Run the program). Click on the Print button (if the button doesn't show up on the screen form make sure you've saved it). Something similar to the following should be displayed:
The picture below shows the controls at the top of the report preview screen:
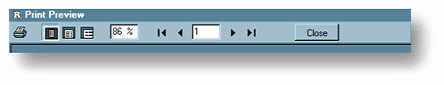
To print the report to a printer click on the printer icon (far left). The next three icons and the percentage entry field control how large the preview is on your screen and how much of the page you see. The second entry field that is surrounded by navigator type buttons controls which page is displayed. You can enter the page number directly or use the first page, previous page, next page or last page buttons. The Close button exits the print preview.
Bring up the Report Editor again and make some changes to the report format; move fields around, add some space at the end of the Detail band, etc. Save the report form and run the program again, no need to recompile unless you add fields to the report.
A Slightly More Complex Report
In this version of the Simple Report you're going to add a second page, access a second file (SALES), do some totaling, and even a little print control.
NOTE: If you are running the DEMO version of TAS Professional you will not be able to make these changes since you're limited to a single page in that version of the report writer.
In the SimpleReport format make the following changes:
Increase the size of the Detail band to at least 1.75 inches. This will give you some room for the new objects. Now drop a SubReport object (looks a little like a yellow notepad) in the Detail band below the City and Zip fields.
NOTE: SubReports MUST ALWAYS be placed in Detail bands. You will not get the desired results if you place it anywhere else.
Uncheck the ParentWidth property check box and then change the Left property to 3.0833 (must be done in this order). This will allow you to start the layout of the subreport at the left side and still have the lines align properly. This isn't necessary, however, it gives you an idea of what can be done.
Since this is a SubReport you need to set the Tag property. The number you set here will be the same value you specify in the RB_NUM option in the report commands in your program. Since the main page defaults to 1 this must be from 2 to 15. You should always increment the Tag property sequentially, that is, use 2 then 3, then 4, etc. Set the Tag value to 2.
NOTE: In very complex reports where you have several SubReports and the buffers are linked to previous buffers don't worry about keeping the links in order. For example, you might have buffer 2 and 5 linked to 1, buffer 3 linked to 2 and buffer 4 linked to 3.
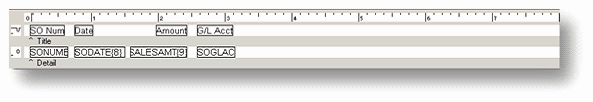
At the bottom of the edit window you should now see two tabs. One will say Main, this is the first or default page, and one will say SubReport1 (if you haven't changed the Caption). If you click on the SubReport1 tab you will see three empty bands, Title, Detail and Summary. You aren't going to use Summary so click on the menu item Report->Summary and that band will disappear. In the Title band (this will print each time this SubReport is printed) place the following objects (the Top property should be 0 for all):
| TppLabel: | Caption=SO Num Left=0.0833 |
| TppLabel: | Caption=Date Left=0.75 |
| TppLabel: | Caption=Amount Left=1.9687 |
| TppLabel: | Caption=G/L Acct Left=2.5833 |
Move the Title band bar up until it is directly under the TppLabel objects. The PrintHeight property for the band is automatically phStatic. If you don't reduce the space under the objects there will be a space between the titles and the data. If you want to include a space you would do that here by leaving some distance between the bottom of the labels and the Title band bar.
In the Detail band place the following objects (again the Top property should be 0 for all):
| TppDBText: | DataField=SONUMBER Left=0.0833 Width=0.5687 |
| TppDBText: | DataField=SODATE Left=0.75 Width=0.7583 |
| TppDBText: | Alignment=taRightJustify DataField=SOSALESAMT Left=1.5833 Width=0.8531 |
| TppDBText: | DataField=SOGLACCTNUM Left=2.5833 Width=0.5729 |
Again, you want to reduce the space under the objects by moving the Detail band bar up until it's directly under the line of objects.
Click on the Main tab and return to the first page. You'll probably want a total to print for each group of orders so you'll need to use the Group feature. To do so, click on the Report menu item and then the Groups option. The following dialog will be displayed:
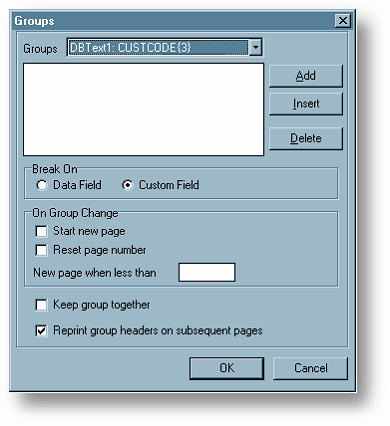
In your Groups box, CUSTCODE may not be the first item displayed, it depends on the order you placed the objects on the report form. If CUSTCODE is not at the top click on the down arrow and choose it. Next click on the Add button. This will choose the CUSTCODE object as the controlling field for this group. Each time CUSTCODE changes the report will consider the group to change.
The group specifier (Group[0]:DBText1: CUSTCODE will be displayed in the group box directly under the drop down box. You can now make other choices for this group. The Break On value will always be Custom Field so you don't have to change this. If you want to always start on a new page (this would be the normal choice for checks, invoices, etc.) you would check the Start new page option, in this case it would just be a waste of paper so leave it unchecked. The Reset page number option applies only if you check Start new page so this will remain unavailable. The New page when less than option expects a number of lines to be entered. This is similar to Start new page, again we'll leave it at the default value. Keep group together will make sure that a group doesn't start on a page unless there's enough room to print all the lines for that group. You don't have enough data to fill a page, however, if you add some data you can see this at work, so leave this option checked. You aren't going to enter any group header objects so uncheck the Reprint group headers option. Then click the OK button to create the new group.
After you create the group you will notice two new band bars. One is the Group Header[0]: and the other is Group Footer[0]: You're not going to add any new objects to the group header so just ignore it. However, you are going to put a field in the group footer. Increase the size of the group footer by clicking on the Group Footer[0] band bar and, while holding down the left mouse button, move the bar down the screen. You won't need much room, just enough for one line and a little extra. The ending Height property value for this band should be something near 0.3021.
The total values will be placed in the group footer band. This band will print once each time the group changes at the end of the group information. In the Group Footer[0] band place the following objects:
| TppLabel: | Caption=Total Sales Amount: Left=3.4896 Name=ppTSALbl Top=0 |
| TppDBText: | Alignment=taRightJustify DataField=TotSales Left=4.8437 Name=ppDBTSA Top=0 Width=0.6771 |
For both of the objects above check the OnPrint Control Flag checkbox. This will tell the program to check for a field that has the same name as the object in the source program. If one is found then during the report the field will be checked for the value "ON" or "OFF". If the field is set to "ON" then the object will print, if set to "OFF" it won't.
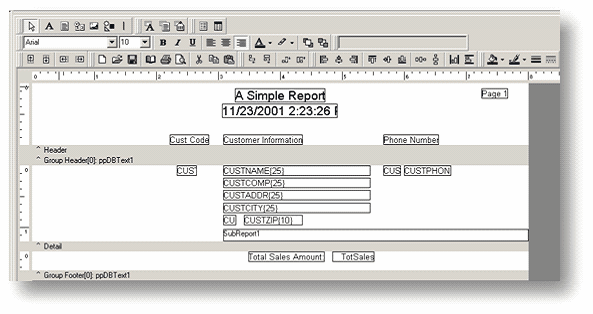
Notice that the Name property for both of these objects has been changed from the default value. You didn't have to, however, you're going to refer to these objects in your program. This is the same concept you followed when you created your first screen form at the beginning of this tutorial. When you're done the report form should look something like the following:
Main Page:
SubReport1 Page:
Finally, you need to save the report format. To make things simpler, just save the new format using the same name. Click on the File menu item and then the Save option. You don't have to exit out of the Report Editor at this time.
IMPORTANT NOTE: YOU MUST BE ON THE MAIN PAGE EACH AND EVERY TIME YOU SAVE A REPORT FORMAT. IF YOU DON'T THE FORMAT WILL NOT BE ABLE TO BE LOADED THE NEXT TIME.
Go back to the Source Editor and load the SOEntry.SRC file if it isn't already. Modify the source code so that it matches the following:
btnPrint.click:
define TotSales type n size 10 dec 2
define ppTSALbl, ppDBTSA type a size 3
set_object get_form_name() property 'No_Refresh' value True
setup_report_buff rb_num 1 reportname 'simplereport'
setup_report_buff rb_num 2 link_to 1
scan @cust_hndl key custcode
output_report_data rb_num 1
TotSales = 0
scan @sales_hndl key SOCUSTCODE start custcode while socustcode=custcode
TotSales = TotSales + SOSALESAMT
output_report_data rb_num 2
ends
ppTSALbl = iif(TotSales=0,'OFF','ON')
ppDBTSA = ppTSALbl
update_report_data rb_num 1 fldlst 'TotSales','ppTSALbl','ppDBTSA'
ends
print_report
set_object get_form_name() property 'No_Refresh' value False
ret
The first changes after the event label are two DEFINE commands. The first creates a field (TotSales) that will be used to total the individual sales records for each group. The second creates two fields (ppTSALbl and ppDBTSA) that match the names you assigned to the two fields that print in the Group Footer[0] band. These fields will be used to turn off the printing of the objects if the TotSales value is 0.
There are two SET_OBJECT commands at the beginning and end of the routine to turn off the screen refresh process. If you don't do this the entSOCust.Change event will be called each time a SALES record is found. The first SET_OBJECT turns the refresh off the second turns it back on, which must be done before you exit this routine.
The first SETUP_REPORT_BUFF command you have already seen. The second now sets up the SubReport1 page. The RB_NUM 2 option here connects to the Tag property value you set for the SubReport object when you placed it on the Main page. The LINK_TO 1 tells the program that the records in buffer 2 are connected to the records in buffer 1. If you don't do this the sales records will not print since they won't be found when the customer records are printed.
The SCAN command accessing the CUSTOMER file is the same as the previous version along with the OUTPUT command. Next the TotSales field is initialized. A new SCAN command is inserted into the CUSTOMER loop to search for SALES records for the particular customer. The START option uses the current CUSTCODE value to find the first SALES record and the WHILE option will find records that only match the current customer.
The next line totals the sales amounts and then the information for the SubReport is output to buffer 2. The ENDS command is the end of the scan loop for the SALES file.
The next three lines control whether or not the sales total will print at all. The first line tests whether the TotSales field is 0. If it is then the field ppTSALbl is set to 'OFF', otherwise it's set to 'ON'. Then the second field is set to the same value as the first. The third line updates the data output by the original OUTPUT RB_NUM 1 command. Until the next OUTPUT command to the same buffer number the last data values remain in memory and can be changed with the UPDATE command. That's what's happening in this case. You're updating the TotSales values and whether or not to print that object and the TppLabel object that also prints in the group footer band. As explained previously, if the fields that have the same name as the objects are set to "OFF" the objects won't print, if set to "ON" they will.
The rest of the routine is the same except for the SET_OBJECT command that turns the screen refresh back on.
Compile the program, and, assuming you don't have any errors, run it. When you print the report it should look something like this:
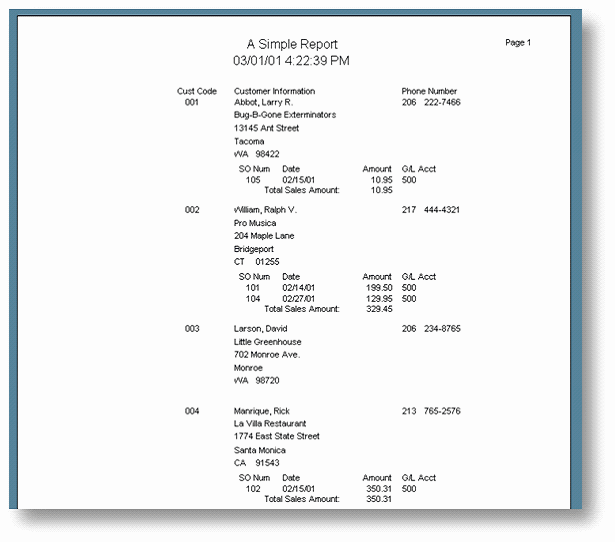
The sample above includes some extra SALES records that were entered separately.
If you find the TotSales prints even when it's zero make sure you've checked the OnPrint Control Flag for both objects that are in the Group Footer[0]. Click on the object and check the box at the top of the OI. Don't forget to resave the report format. You don't have to recompile the program after a change like this.
This finishes the second report. You should now have an idea of the power of the report writer. Very complex reports can be created easily and quickly with a minimum of code required.
Next Chapter Part 5 - Adding a Menu to a TAS Professional program.
Page url: http://www.cassoftware.com/tas/manual/part4_creatingatasprofes.htm