|
FL-Q - Report Builder |

  
|
|
FL-Q - Report Builder |
|
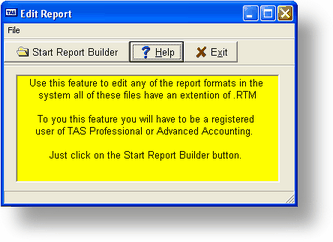
Purpose of Program
Use this program to edit any of the graphical reports that are in your system. When you choose this menu option the screen below will be displayed.
The Report Painter
The Report painter is your key to productivity when creating reports in TAS Professional. The TAS Professional engineers have made every effort to ensure that the Report painter interface is consistent with other Windows programs you've used before. The major areas of the Designer are listed below.
Warning: if you are not from a programming background we recommend you contact your IT support team or Computer Accounting Solutions. Person's without some strong programming background could damage existing report formats in your system.
When you click on the Start Report Builder you will be presented with the screen below.
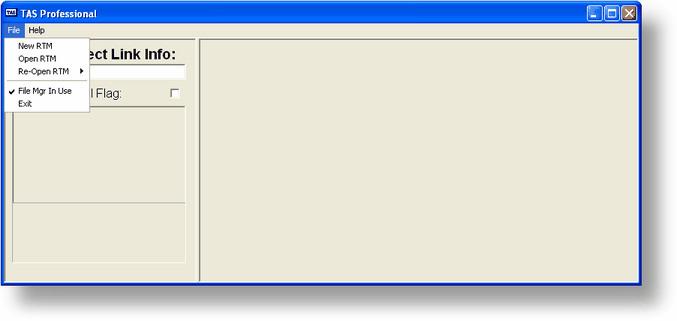
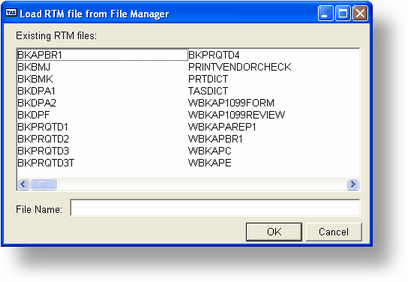
Use the File menu option to find an existing file in the program manager to edit or use the new option to create a new report format. Whne you Click on the open menu option you will get a list of all of the report formats in the system.
After you choose a report format the report painter screen will be shown.
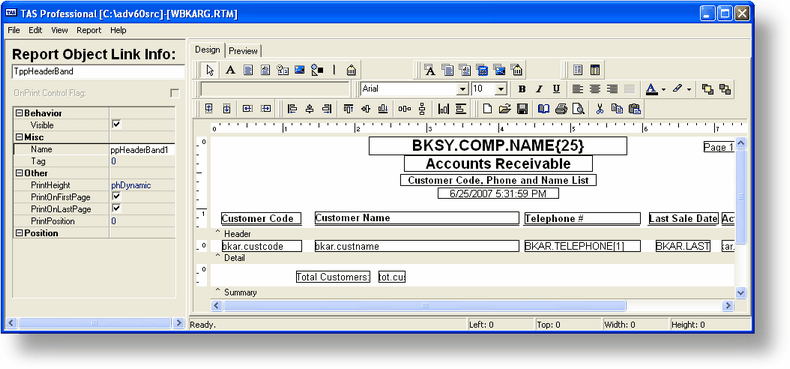
Component Palette Toolbars
These toolbars are used to create new components. To create a component, click on the icon and then click in the white space
of a band. There are three component toolbars: Standard, Data, and Advanced.
Use the Standard components to create text, lines, shapes, memos, richtext, etc.
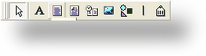
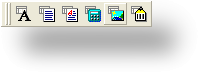
Use the Data components when you want to display the data from a database.
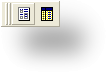
Use the Advanced components when you need to create more complex reports using subreports, regions, or crosstabs.
Object Inspector
The object inspector allows you to set the most important property for a given component. For example, when a Label component is selected, an edit box appears that allows you to set the Caption. When a DBText component is selected, two drop-down lists appear that allow you to set the DataField.
Format Toolbar
This toolbar appears to the right of the Edit toolbar. It's used to configure the font of textual components and to control component layering via the Bring to Front and Send to Back commands.
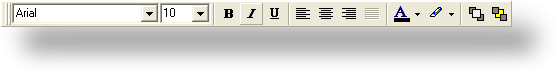
Standard Toolbar
This tool bar is used to save, cut,copy, paste,print and other file operations
Rulers
The horizontal ruler allows you to determine a component's position on the page. The vertical ruler for each band allows you to determine a component's position relative to the starting print position of the band.
All Bands
Notice the gray rectangular area below the white space of each band. This area is draggable, and it allows you to redefine the height of the band.
Status Bar
The Status Bar shows messages and object positions.
Working with the Report Painter
Overview
The Report painter Designer is actually a sophisticated component editor for the report component (other examples of component editors in TAS Professional are the Menu Editor of the TMenu component.
The Report painter enables you to quickly and easily lay out complex reports in much the same way as the TAS Professional Form painter.
In TAS Professional.
Some tips to help you get the most out
of Report painter:
Maximize the Report Designer window and use the speed menus as much as possible.
To resize the bands using the mouse, position the mouse over the gray rectangular area below the white space of the band, press the left mouse button, and drag.
To make a particular band appear as the selected object in the Object Inspector, position your mouse cursor anywhere over the open white space of the band (not over a component in the band) and click the left mouse button.
You can cut, copy, and paste one or more report components at a time either in the same report or between different reports.
The Report Tree
You can display the Report Tree by selecting the View | Toolbars | Report Tree menu option. The report tree shows all of the bands and components in the report. The components for each band are listed in layered order (the order established via the Bring to Front and Send to Back commands). The bottommost component is listed first; the topmost component is listed last. You can use the Report Tree to see exactly what components are contained in the report and to select individual components.
You can turn on the Report Outline by right-clicking over the Report Tree. The Report Outline is useful when you have subreports in your report. You can select any subreport in the Report Outline and the bands and components for that subreport will appear in the Report Tree. (The subreport will also be displayed in the Report painter.)
Report Components
Overview
The Report painter Report object Library provides a powerful, robust set of report objects that have been designed and optimized specifically for the reporting environment in TAS Proffesional. The library includes over 20 components that enable you to put all types of data in your reports: Lines, Shapes,Text, Memos, RichText, Images, Charts, and BarCodes. Advanced components such as Regions, SubReports, and CrossTabs can be used to elegantly model complex reports.
Memo
Used to print multiple lines of plain text in a report. To set the value, assign a string list to the Lines property. To dynamically resize the memo during printing, set the Stretch property to True. Use the ShiftRelativeTo property to define dynamic relationships with other stretchable objects.
RichText (Not implemented in TAS pro yet)
Used to print formatted text. To set the value, assign the RichText property.
Label
Used to display text. Assign the Caption property to control the text value. To resize the label automatically so it fits a changing caption, set the Auto-Size property to True.
LoadFromFile or LoadFromRTFStream methods. Use the ShiftRelativeTo property to define dynamic relationships with other stretchable
objects. At design-time you can use Report-painters built-in RTF Editor to load, modify, and save rich text data stored in files.
SystemVariable
Used to display common report information such as page number, page count, print date and time, date, time, etc. The type of information displayed is controlled by the VarType property. The format is controlled by the DisplayFormat property.
Image
Used to display bitmaps and windows metafiles in reports. Assign the Picture property of this component in order to place an image in your report. Use the Report Designer's built-in picture dialog to load images at design-time.
Shape
Use this component to print various shapes (squares, rectangles, circles, ellipses). Set the Shape property to select a type of shape. Use the Brush and Pen properties to control the color and border respectively.
TeeChart (Not inplemented)
Used to display standard (non-data-aware) Tee-Charts. This component enables you to use Tee-Chart inside the Report Designer. You can access the TeeChart editor via a popup menu.
BarCode
Used to render barcodes. The string value assigned to the Data property is encoded based on the Bar-CodeType. If the data to be encoded is in a database, use DBBarCode. The following symbologies are supported: Codabar, Code 128, Code 39, EAN-13, EAN-8, FIM A,B,C, Interleaved 2 of 5, Post-Net, UPC-A, UPC-E.
CheckBox (Not implemented)
Displays a checkbox using the WingDings font.
DBText
Used for displaying values from all types of database fields. Use the DisplayFormat property to format the value.
DBMemo
Used to print plain text from a memo field of a database table. This control will automatically word-wrap the text. Set the Stretch property to True and the component will dynamically resize to print all of the text. Use the ShiftRelativeTo property to define dynamic relationships with other stretchable objects.
DBRichText (Not implemented)
Used to print formatted text from a memo or BLOB field of a database table. This control will automatically word-wrap the text. Set the Stretch property to True and the component will dynamically resize to print all of the text. Use the ShiftRelativeTo property to define dynamic relationships with other stretchable objects.
DBCalc
Used for simple database calculations (Sum, Min, Max, Count and Average). The value can be reset when a group breaks using the ResetGroup property.
DBImage
Used to print bitmaps or windows metafiles, which are stored in a database filenales or BLOB field. (Blob fileds have not yet been implemented)
DBBarCode
Used to render barcodes based on the BarCode-Type and the value supplied via the DataField property. The following symbologies are supported: Codabar, Code 128, Code 39, EAN-13, EAN-8, FIM A,B,C, Interleaved 2 of 5, PostNet, UPC-A, UPC-E.
DBTeeChart (not implemented)
Allows data-aware TeeCharts to be placed within a report.
DBCheckBox(Not implemented)
Displays a checkbox based on the value of the field specified in the DataField property. Can be used with a Boolean field (or any other type of field via the BooleanTrue, BooleanFalse properties).
Region
Used to logically group components together. Use the ShiftRelativeTo property to move the region in relation to another dynamically resizing component (such as Memo, RichText, or child-type Sub-Report).
SubReport
Used to handle multiple master details, create sideby-side reporting effects, and hook reports together as one. If you need a report to print within the context of a band, use a child-type subreport. If you need to hook reports together, use a section type subreport. The PrintBehavior property determines the subreport type.
CrossTab (Not implemented)
Used to present summarized data in a grid format.
Page url: http://www.cassoftware.com.com/adv7docs/index.html?fl_q___report_builder.htm